
Uptime Kuma: Self-Hosted Uptime Monitoring for Sites and Servers
Uptime Kuma is a free, open-source uptime monitoring service. It checks your sites and servers at regular intervals, notifies you when something stops responding, and shows the history as clear graphs. In effect it is your own replacement for UptimeRobot with no limit on the number of checks.
What Uptime Kuma can do
- HTTP(S), TCP port, ping, DNS record, database and Docker container checks;
- keyword search on a page and status code checks;
- SSL certificate expiry monitoring;
- notifications to more than 90 services, including Telegram, email, Slack and Discord;
- public status pages on your own domain;
- scheduled maintenance windows during which no notifications are sent.
Where to host the monitoring
Monitoring must not run on the server it watches: if that server goes down, nothing is left to send the alert. Put Uptime Kuma on a separate small VPS, ideally in another data centre. 1 GB of RAM is enough.
Installation
You need Docker and Docker Compose — see the installation guide.
mkdir -p ~/uptime-kuma && cd ~/uptime-kumaCreate docker-compose.yml:
services:
  uptime-kuma:
    image: louislam/uptime-kuma:2
    container_name: uptime-kuma
    restart: unless-stopped
    volumes:
      - ./data:/app/data
    ports:
      - "127.0.0.1:3001:3001"
docker compose up -dThe port is published on the loopback address only. To open the service on a domain with HTTPS, set up a reverse proxy: create a proxy host with WebSocket support in Nginx Proxy Manager, or use the Nginx reverse proxy template — it already has the required headers.
First launch
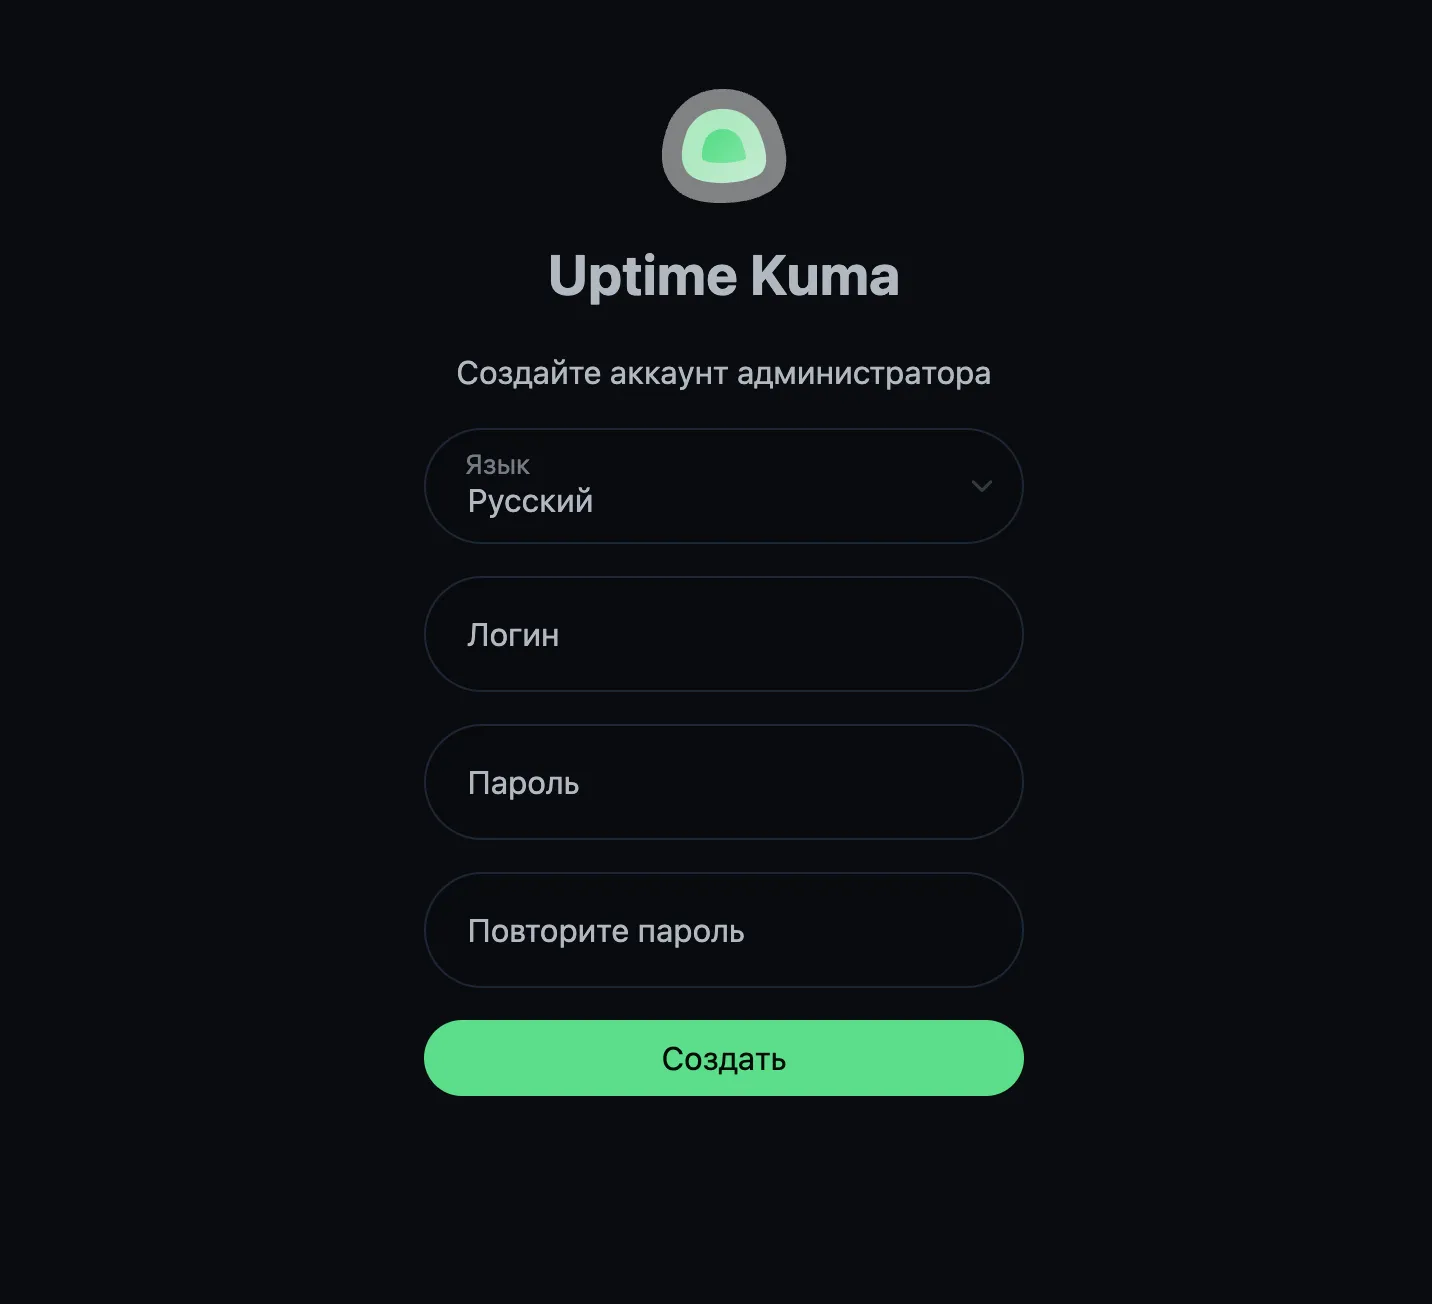
Open the service address in a browser. The setup wizard asks you to:
- choose a database. SQLite is fine for personal use; pick the embedded MariaDB for hundreds of monitors;
- create the administrator account.
Right after logging in, enable two-factor authentication: Settings → Security.
Adding a monitor
Click Add New Monitor and fill in the main fields.
- Monitor Type.
HTTP(s)for sites,TCP Portfor services such as SSH or mail,Pingto check that a server is reachable. - Friendly Name — what the monitor is called in the list.
- URL, or an address and port.
- Heartbeat Interval. 60 seconds is a sensible default.
- Retries. Set 2–3: a notification is sent only after several failures in a row, so brief network glitches do not cause false alarms.
For sites it is worth enabling certificate expiry checks — Uptime Kuma warns you a few days in advance.
Keyword check
A site can return status 200 while showing a database error. The HTTP(s) - Keyword monitor type checks that the page contains a given text — for example a phrase from the footer.
Monitoring Docker containers
To watch container state, give Uptime Kuma access to the Docker socket. Add to docker-compose.yml:
    volumes:
      - ./data:/app/data
      - /var/run/docker.sock:/var/run/docker.sock:ro
Then add a host with the Socket connection type under Settings → Docker Hosts and create a monitor of type Docker Container.
Push monitors
The Push type works the other way round: Uptime Kuma waits for a request to a special URL. If the request does not arrive in time, the monitor is considered down. It is a convenient way to watch cron jobs such as backups:
0 3 * * * /usr/local/bin/backup.sh && curl -fsS https://status.example.com/api/push/XXXXXXXX > /dev/nullTelegram notifications
- Create a bot with @BotFather using
/newbotand copy the token. - Send your bot any message.
- In Uptime Kuma open Settings → Notifications → Setup Notification and choose the Telegram type.
- Paste the token, click Auto Get next to the Chat ID field, then Test.
- Enable Apply on all existing monitors and save.
Status page
A public page shows customers or colleagues the state of your services without logging in to the panel.
- Open Status Pages → New Status Page.
- Set the page name and address.
- Add groups and drag the monitors you want into them.
- Optionally set your own domain — it must point to the Uptime Kuma server.
You can post incident and maintenance messages on the page.
Maintenance
If you plan work on a server, create a window under Maintenance: notifications for the selected monitors are paused for that time and a notice appears on the status page.
Updating
cd ~/uptime-kuma
docker compose pull
docker compose up -d
Upgrading from version 1
Version 2 uses a new database format. Before upgrading:
- stop the container and back up the data directory;
- change the image tag to
louislam/uptime-kuma:2and start the container.
Data migration runs automatically on first start and can take a noticeable time with a long history — do not interrupt it. After migration, going back to version 1 is only possible from a backup.
Backups
All settings, monitors and history are in the data directory. Copying it off the server regularly is enough, for example with rsync.
What Uptime Kuma does not replace
The service answers “is it reachable or not”, but it does not show why a server is slow. For CPU, memory and disk metrics use Grafana and Prometheus or Zabbix — they complement each other well.