
Install Zabbix 8.0 LTS on Ubuntu 24.04
Zabbix is an open-source monitoring system: it collects metrics from servers, network equipment and applications, draws graphs and sends alerts about problems. Below is how to install the current 8.0 LTS release on Ubuntu 24.04 with a MySQL database and the Nginx web server.
Requirements
For a small installation (up to a hundred hosts) a VPS with 2 cores, 4 GB of RAM and 20–30 GB of disk is enough. Most of the space goes to metric history in the database.
All commands are run as root:
sudo -sStep 1. Zabbix repository
wget https://repo.zabbix.com/zabbix/8.0/release/ubuntu/pool/main/z/zabbix-release/zabbix-release_latest_8.0+ubuntu24.04_all.deb
dpkg -i zabbix-release_latest_8.0+ubuntu24.04_all.deb
apt update
For Ubuntu 22.04 or 26.04, replace 24.04 in the file name with your release number.
Step 2. Install the packages
apt install -y zabbix-server-mysql zabbix-frontend-php zabbix-nginx-conf zabbix-sql-scripts zabbix-agent2zabbix-server-mysql— the monitoring server;zabbix-frontend-phpandzabbix-nginx-conf— the web interface and its Nginx configuration;zabbix-sql-scripts— the database schema;zabbix-agent2— the agent that collects metrics from the server itself.
Step 3. Database
apt install -y mysql-server
mysql
CREATE DATABASE zabbix CHARACTER SET utf8mb4 COLLATE utf8mb4_bin;
CREATE USER 'zabbix'@'localhost' IDENTIFIED BY 'a_strong_password';
GRANT ALL PRIVILEGES ON zabbix.* TO 'zabbix'@'localhost';
SET GLOBAL log_bin_trust_function_creators = 1;
EXIT;Import the schema and initial data. The command asks for the zabbix user’s password; the import takes a few minutes:
zcat "$(dpkg -L zabbix-sql-scripts | grep 'mysql/server.sql.gz')" | mysql --default-character-set=utf8mb4 -uzabbix -p zabbixAfter the import, restore the setting:
mysql -e "SET GLOBAL log_bin_trust_function_creators = 0;"Step 4. Configure the Zabbix server
Set the database password in /etc/zabbix/zabbix_server.conf:
DBPassword=a_strong_passwordStep 5. Configure Nginx
In /etc/zabbix/nginx.conf, uncomment and fill in two lines:
listen 80;
server_name zabbix.example.com;
If the server hosts no other sites, disable the default page so it does not intercept requests:
rm /etc/nginx/sites-enabled/defaultStep 6. Start the services
systemctl restart zabbix-server zabbix-agent2 nginx php8.3-fpm
systemctl enable zabbix-server zabbix-agent2 nginx php8.3-fpm
Make sure the server started without errors:
systemctl status zabbix-server
tail -n 20 /var/log/zabbix/zabbix_server.log
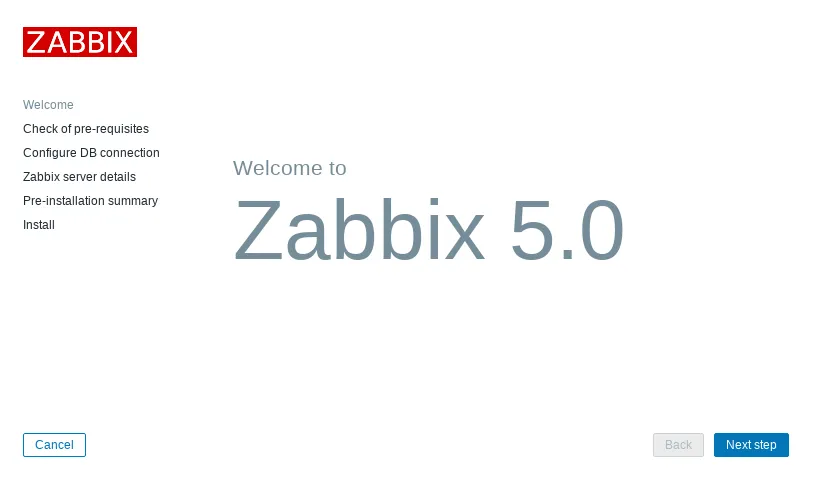
Step 7. Setup wizard
Open http://zabbix.example.com in a browser.
- Choose the interface language.
- Check that all prerequisites are marked as met.
- Enter the database details: name
zabbix, userzabbixand the password. - Set the server name and time zone.
First login credentials: user Admin, password zabbix.
Step 8. HTTPS
A monitoring interface must not run over unencrypted HTTP:
apt install -y certbot python3-certbot-nginx
certbot --nginx -d zabbix.example.com
Adding other servers
On every server you want to monitor, add the Zabbix repository (step 1) and install the agent:
apt install -y zabbix-agent2In /etc/zabbix/zabbix_agent2.conf, set the Zabbix server address and the host name:
Server=203.0.113.10
ServerActive=203.0.113.10
Hostname=web-01
Restart the agent and open port 10050 for the Zabbix server’s address:
systemctl restart zabbix-agent2
ufw allow from 203.0.113.10 to any port 10050 proto tcp
In the web interface open Data collection → Hosts → Create host, enter the same host name, add the Linux by Zabbix agent template and an agent interface with the server’s IP address. Data starts arriving within a couple of minutes.
Next steps
- Set up notifications under Alerts → Media types: Zabbix can send messages by email, to Telegram and other messengers.
- For visual dashboards, connect Zabbix as a data source to Grafana.
- For simple availability checks without agents, use Uptime Kuma.