

Telegram Alerts for High Server Load
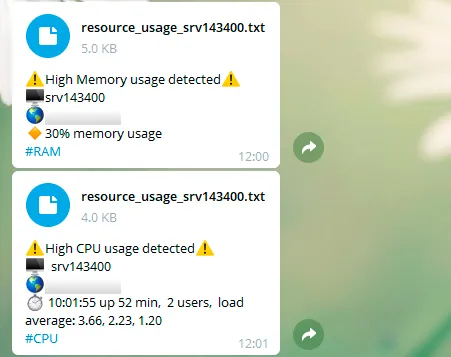
It is better to learn about a server problem before the site stops opening. For one or two servers you do not need a full monitoring system: a small script that checks the load every few minutes and messages you on Telegram when it crosses a threshold is enough.
What we monitor
- Load average — the average number of processes waiting for CPU or disk. Compare it with the number of cores: a load of 4 on a four-core server means it is fully busy.
- Memory — the share of RAM in use.
- Disk — how full the root partition is. A full disk stops databases and mail.
Step 1. Create a bot
- Open a chat with @BotFather in Telegram and send
/newbot. - Set the bot’s name and username and save the token you receive.
- Send your bot any message.
- Find the chat ID:
curl -s "https://api.telegram.org/bot<TOKEN>/getUpdates"Look for "chat":{"id":123456789 in the response.
If you already created a bot for SSH login notifications, reuse it.
Step 2. Create the script
sudo nano /usr/local/bin/load-alert.sh#!/bin/bash
# Telegram alert for high load, low memory and low disk space.
TOKEN="123456789:AAH..."
CHAT_ID="123456789"
LOAD_PER_CORE=1.5 # load threshold per core
MEM_LIMIT=90 # used memory threshold, %
DISK_LIMIT=90 # disk usage threshold, %
REPEAT_AFTER=3600 # do not repeat the message more often than every N seconds
STATE=/var/tmp/load-alert.state
CORES=$(nproc)
LOAD=$(cut -d' ' -f1 /proc/loadavg)
MEM=$(free | awk '/^Mem:/ {printf "%.0f", ($2-$7)/$2*100}')
DISK=$(df --output=pcent / | tail -n 1 | tr -dc '0-9')
PROBLEMS=""
if awk -v l="$LOAD" -v c="$CORES" -v t="$LOAD_PER_CORE" 'BEGIN {exit !(l > c*t)}'; then
PROBLEMS+="Load: $LOAD on $CORES cores"$'\n'
fi
[ "$MEM" -ge "$MEM_LIMIT" ] && PROBLEMS+="Memory is $MEM% used"$'\n'
[ "$DISK" -ge "$DISK_LIMIT" ] && PROBLEMS+="Disk is $DISK% full"$'\n'
# all good: reset the state and exit
if [ -z "$PROBLEMS" ]; then
rm -f "$STATE"
exit 0
fi
# do not send the same alert more often than the interval
NOW=$(date +%s)
if [ -f "$STATE" ] && [ $((NOW - $(cat "$STATE"))) -lt "$REPEAT_AFTER" ]; then
exit 0
fi
echo "$NOW" > "$STATE"
TOP=$(ps -eo pcpu,pmem,comm --sort=-pcpu | head -n 6)
TEXT="⚠️ $(hostname)
$PROBLEMS
Busiest processes:
$TOP"
curl -s --max-time 10 \
--data-urlencode "chat_id=${CHAT_ID}" \
--data-urlencode "text=${TEXT}" \
"https://api.telegram.org/bot${TOKEN}/sendMessage" > /dev/nullThe script contains the bot token, so restrict access to it:
sudo chown root:root /usr/local/bin/load-alert.sh
sudo chmod 700 /usr/local/bin/load-alert.sh
Step 3. Test
Run the script by hand:
sudo /usr/local/bin/load-alert.shIf the load is normal, no message is sent — that is the correct behaviour. To test sending, temporarily set MEM_LIMIT=1 and run the script again. Remember to restore the value and delete the state file:
sudo rm -f /var/tmp/load-alert.stateStep 4. Run on a schedule
Open root’s crontab:
sudo crontab -eAdd a line — a check every five minutes:
*/5 * * * * /usr/local/bin/load-alert.shThe schedule format is explained in the cron guide.
Choosing thresholds
- Load.
1.5per core means the server is overloaded by half. Short spikes to that level are usually harmless; if messages arrive too often, raise the threshold to2. - Memory. Linux uses free memory for cache, so the script counts only memory that cannot be reclaimed. Above 90% is worth investigating.
- Disk. 90% is a sensible threshold: it leaves time to free space before services stop.
REPEAT_AFTER protects against a flood of identical messages: while the problem persists, the alert repeats at most once an hour.
What to do when an alert arrives
The message already lists the busiest processes. These commands help next:
top                 # processes in real time
free -h             # memory
df -h               # disk space
du -sh /var/log/*   # what takes up space in the logs
Limits of the script
The script runs on the server it watches. If the server hangs or loses its network, no alert is sent. To check availability from outside you need a separate service — for example Uptime Kuma — on another VPS. When you have more servers and need metric history, move to Grafana and Prometheus.